2025 THIRD QUARTER COMMENTARY
LOCAL MARKETS IN A NUTSHELL
Delivering a strong 10.2% gain, the FTSE/JSE All Share Index saw solid increases across all sectors. Industrials led with an 11.8% rise, followed by Resources at 9.8%, and Financials at 8.5%. SA listed property continued its rally from the previous quarter delivering 10.8% (FTSE/JSE All Property Index), all in rand.
South African bonds returned 5.9% for the quarter, outperforming their global counterparts (Bloomberg Global Aggregate Bond Index) in rand terms.
Chart: Performance of the FTSE/JSE All Share Index over the past ten years (2015/07/01 – 2025/06/30)
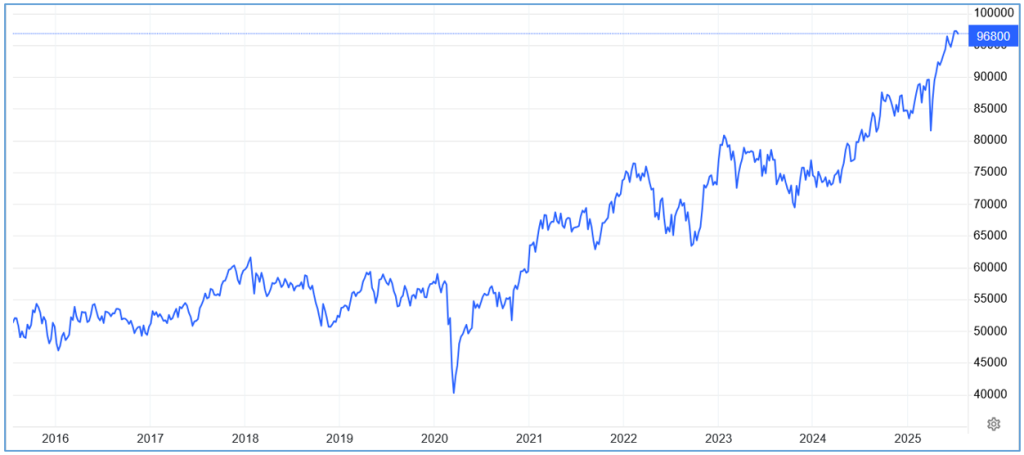
Source: tradingeconomics.com
It was yet another eventful quarter. South Africans watched with bated breath as Ramaphosa and his delegation arrived at the White House in May, to meet with Trump and his aids, to discuss various matters including the claim of white genocide.
All things considered, Ramaphosa navigated the encounter very well. However, it wasn’t enough to shift trade relations in South Africa’s favour. The US has announced a 30% trade tariff on South Africa from the 1st of August. Trump has also threatened an additional 10% tariff for BRICS-aligned countries.
According to Aluma Capital chief economist Frederick Mitchell, South Africa exported an estimated R71.5 billion through AGOA in 2024, accounting for 46% of total SA exports to the US that year.
South Africa is among 21 other countries that are subject to tariffs come the 1st of August.
The continued dismay within the GNU came as no surprise as resource stocks continued their rally amongst a spike in global demand
“The local equity market performed strongly during the quarter, with the JSE Capped SWIX delivering a total return of 9.7%. This was mainly driven by a continued rally of 13% by companies in the resources sector. Local bonds also rallied this quarter as concerns about the longevity of the GNU waned and a sense of calm reemerged. Neither the ANC, nor the DA, wants to be seen as the party responsible for the collapse of the GNU, so the awkward embrace of the erstwhile rivals continues to hold steady. Sadly, the hope of any meaningful and urgent structural reforms remains elusive, given ideological differences and lack of trust between the major parties in government.”
Peregrine Asset Management
The rand gained 3.4% against the US dollar during the quarter but weakened 2.5% versus the UK pound and 5% against the euro.
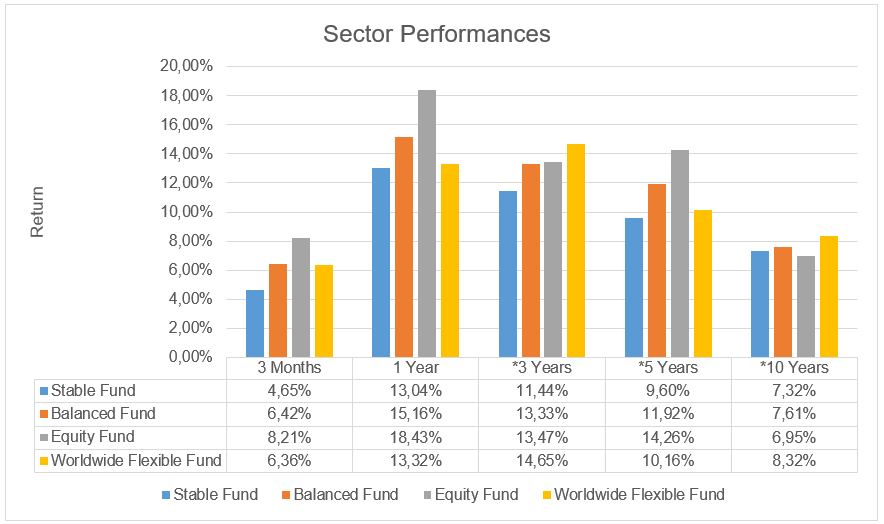
Source: Profile Data 30/06/2025
* Annualised Performance
The contentious issue around South African property as an asset or investment
Historically South African property was considered by some to be a great investment. In recent years this premise has certainly been questioned – and for good reason.
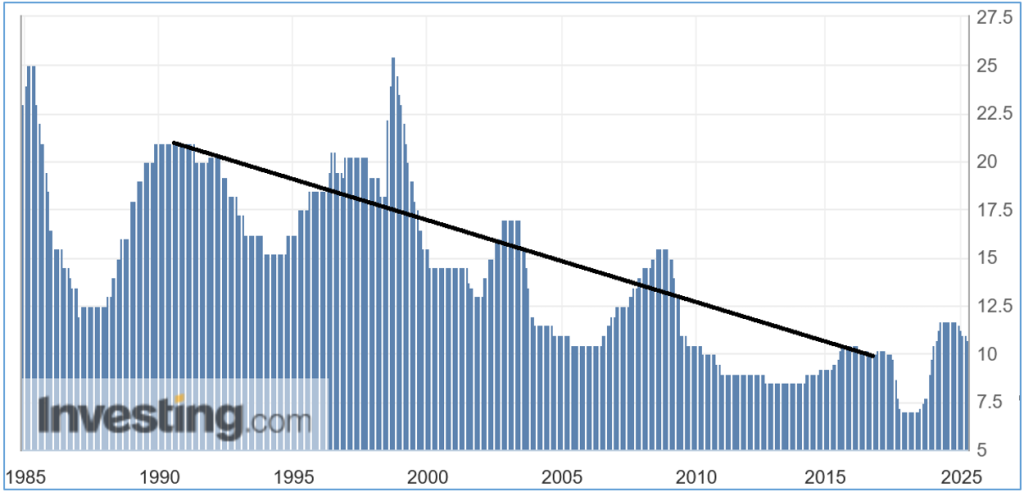
As the chart below shows, in 1998 the prime lending rate reached a high of 25.5%. If one were to look at the interest rate trend from 1990 to 2015, interest rates steadily declined over the period of 25 years.
South African Prime Lending Rate 1985 – 2025
As shown in the chart below, if one were to look at the real residential property price increase (price increase over and above the rate of inflation) in South Africa over the same period (1990 – 2015) we can see that property prices gave very attractive real returns (returns over and above the rate of inflation).
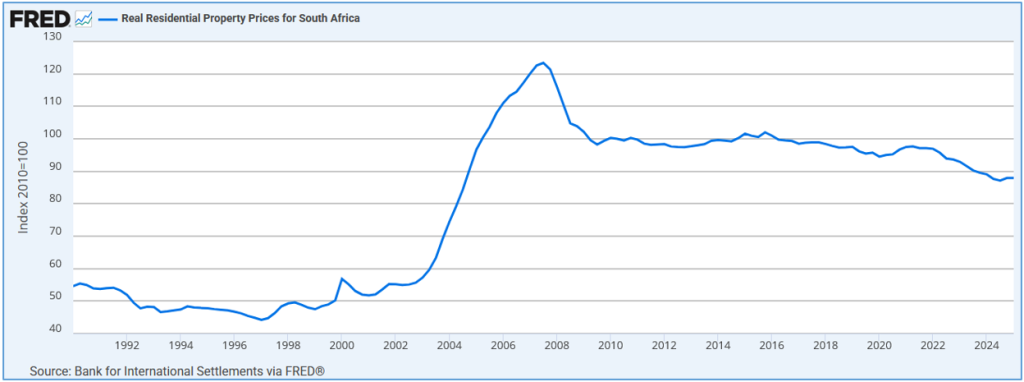
This coincided with a period where interest rates were steadily declining, making it cheaper to service debt. South Africa’s economic growth rate was also relatively strong with a real GDP growth rate (GDP growth after adjusting for inflation) of around 2.5% per annum. This compares to a real GDP growth rate (GDP growth after adjusting for inflation) of around 0.6% per annum over the last 10 years.
We can see from the chart above that real residential property prices (price increase over and above the rate of inflation) has been in decline from around 2015.
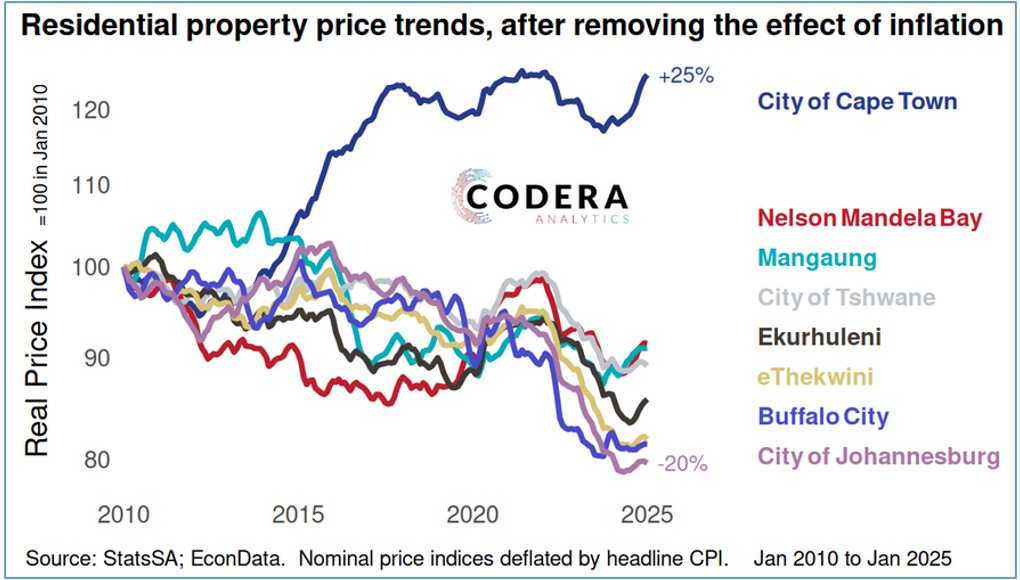
The chart below shows the residential property price trend after accounting for headline inflation in the various metros.
With the exception of the city of Cape Town, residential property has decline in value in real terms (after adjusting for inflation)
The chart below once again shows the residential property price trends in various metros, however owners’ equivalent rent has been used as a measure of inflation.
What does this mean?
The chart reflects the cost of owning a home rather than renting it out. In other words, with the exception of the City of Cape Town, over the last 15 years the average estimated benefit of owning one’s home has been marginally better than renting.
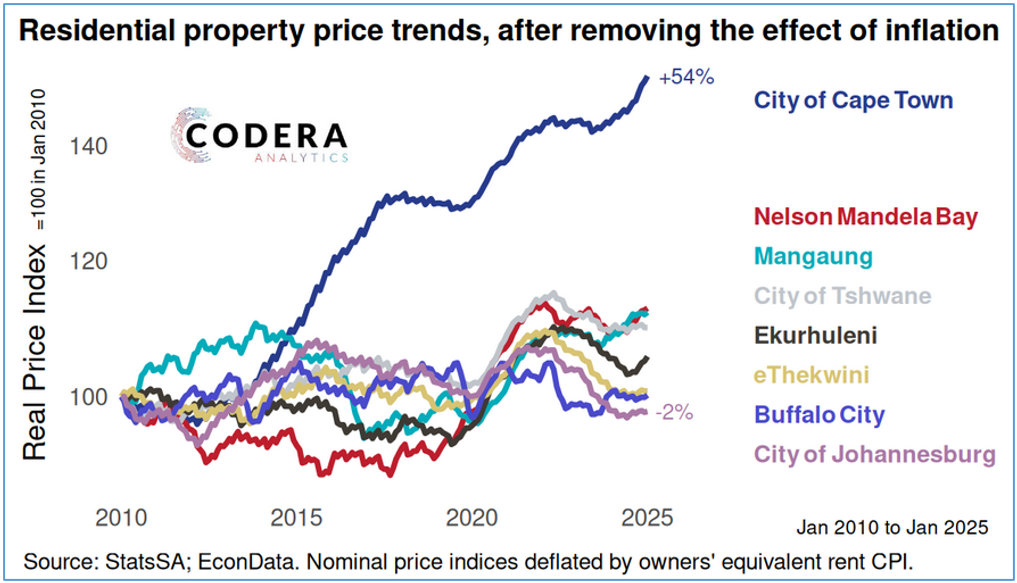
One would typically expect that the benefits to owning one’s home should meaningfully exceed that of renting.
The question to ask is whether the stagnant trend in residential property prices is likely to improve or not? Unfortunately, there is no way making such as call as price trends can vary from province to province as well as from property to property (standalone home, sectional title, number of bedrooms, etc.).
One can, however, consider aspects that could have an impact on property prices as they have done in the past.
Points to consider
- Interest rates can either support or deter the performance of property prices. The South African Reserve Bank has outlined their intention to target a lower inflation rate. This means that interest rates may stay higher for longer in order to attract foreign capital into South Africa. Given South Africa’s economic trajectory it’s unlikely that we will see a sustained period of lower interest rates.
- Living costs continue to escalate in what’s now dubbed the “cost of living crisis in South Africa”. On average, water and electricity costs are increasing by double digits each year. Property rates are also escalating by several percent in excess of inflation, particularly in recent years.“ According to StatsSA, property rates recorded an average annual growth rate of 6.8% between 2009 and 2024 across 39 municipalities, more than doubling in the last 15 years, with inflation increasing by an average of 5.1% per year over the same period” (source: Property Wheel).
- Economic growth in South Africa remains stagnant at around 1% per annum. This is below the population growth rate of 1.6% per annum. Wage growth has also become stagnant alongside economic growth, particularly in the private sector. The increase in the cost of living is therefore on balance, higher than wage increases.
- Tax rates are very high whilst national debt continues to escalate each year.
In short, one may conclude that South Africans are unlikely to receive any sustained meaningful relief from high interest. The cost-of-living crisis is likely to persist across the board. In the absence of a sustained improvement in economic growth, wage growth is likely to remain stagnant with upward pressure on tax collections to pay for a growing annual deficit.
This could have a materially negative impact on property prices as well as a landlord’s ability to increase the rental income on investment property.
Whether one views property as an investment that generates a return (rental property) or an asset that holds its value in real terms (after adjusting for inflation) such as one’s home, the evidence would support the view that South African property is not as robust as it used to be with continued fiscal and macroeconomic challenges expected well into the future.
OUTLOOK (LOCAL)
The outlook remains unchanged. Uncertainty remains with risk to the upside in both the local and global landscape. Investment managers are nevertheless optimistic about select opportunities. Over the last 1, 3 and 5 year period, the average balanced fund has delivered attractive double-digit returns in excess of inflation + 5% per annum.
With global liquidity increasing and financial conditions easing, South African asset prices have the potential to deliver attractive risk adjusted returns despite structural and economic concerns.
“While geopolitical uncertainties and risks remain heightened, the market appears to have digested these risks. Market levels signal more optimism than fear. We are increasingly confident that advancements in AI technologies will reduce costs and accelerate revenues of companies we are invested in, which is incredibly exciting. We remain focused on identifying stock specific opportunities that offer attractive risk reward prospects, while concurrently prioritising downside protection. Our exposure is now more biased to opportunities in the U.S. and South Africa, rather than Europe and China.”
Peregrine Asset Management
OFFSHORE MARKETS IN A NUTSHELL
Global equity markets staged a strong recovery over the quarter. The MSCI world equity index gained 11.5% in US dollars. The broad US market rallied 11.3% over the quarter after a -4.6% decline in the first quarter. Emerging markets were up 12% buoyed by returns from Korea, Taiwan and India. The UK stock market also experienced a meaningful recovery of 8.7% in dollar terms and a lesser 2.4% in pounds.
The graph below represents the MSCI World Equity Index over the last 5 years in US dollar terms.
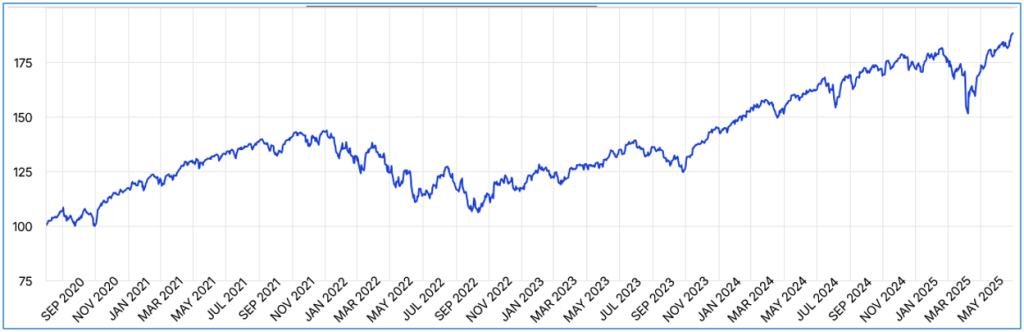
*Performance as of 30/06/2025
The second quarter was characterised by synchronised chaos with several high-profile events unfolding one after another.
On the 2nd of April the world experienced the Trump Tariff Tantrum saga which caused havoc in global markets. A week later Trump announced a 90-day paused on many of the tariffs which provided much need relief to global markets and also sent a message to the world that trade agreements needed to be renegotiated with the US.
Other events soon followed such as the downgrade in US credit rating by ratings agency Moody’s. All major credit ratings agencies have now downgraded the US from the highest rated AAA credit rating. Moody’s attributed their decision to “ballooning deficits and interest costs” with US debt at a record $37 trillion.
We also witnessed tensions unfolding between India and Pakistan which could have easily escalated into a larger conflict. This was followed by the conflict between Israel and Iran which soon saw intervention by the US who bombed the Iranian nuclear enrichment facilities. Crude oil prices increased over 10% to around $78/barrel increasing inflation fears, before falling back to around $68/barrel.
Surprisingly, markets have absorbed these events fairly well.
The US dollar continued its weakening bias which has helped to cushion some of the geopolitical uncertainty.
Don’t time the market, trust the strategy
With all the noise and conflict that has unfolded over the last 6 months, its no wonder than investors are anxious about the structural changes in the global geopolitical and economic land scape.
Some investors are questioning where the world is headed, recognising the rate of change in extremism around the world. The uncomfortable truth is that no one knows, and that investment decisions should not be based off such unquantifiable information.
History provides a perspective during times of uncertainty and a rationale as to the behavioural dynamics of decision-making processes.
As the chart below shows, if one were to take the last 13 declines of 19% or more in the S&P 500 Index (the favoured US index) as an example for periods of panic, the average decline amounts to 29% with an average period of 23 months of decline from peak to trough (highest to lowest point). The most notable point is that the index recovered with an average recovery period of 13 months.
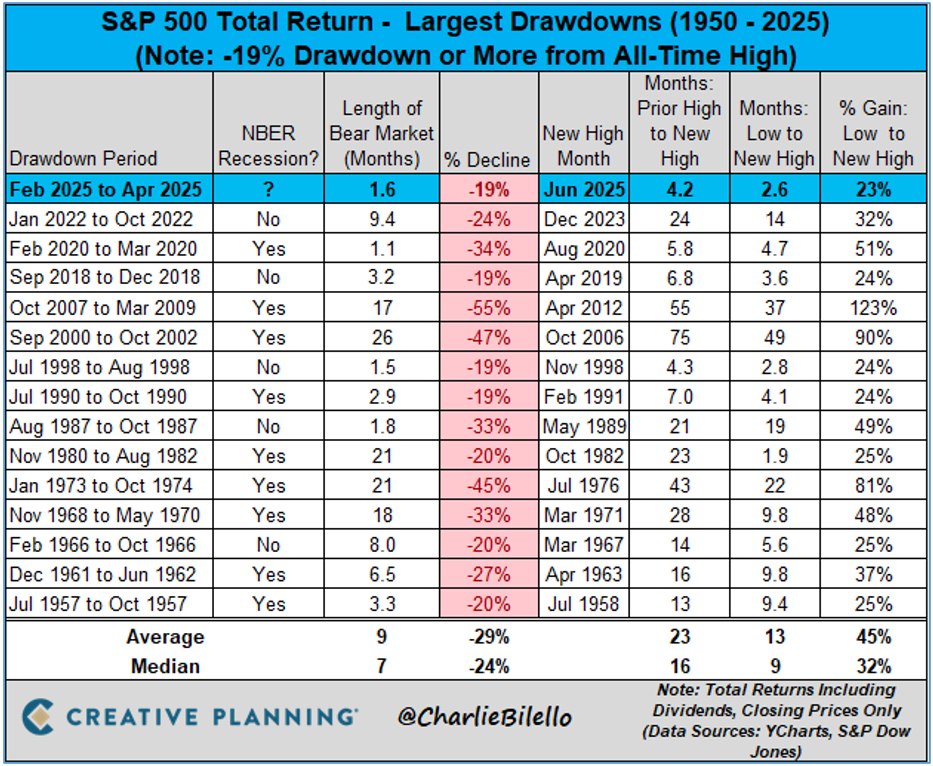
To some extent this highlights the dangers of trying to time the market based on market sentiment. How did you feel during the Trump Tariff Tantrum of April 2025, the Russian invasion of Ukraine in 2022, the US technical recession of 2018 and the Global Financial Crisis of 2008/2009 or the Dot.com Bubble of 200/2002?
Despite how one feels during these times of uncertainty, a well-considered long-term strategy helps to guide investors towards prudent decisions processes.
This is extremely relevant in the current market environment where uncertainty is widespread, and investors are feeling vulnerable to exogenous factors such as trade wars and a Trump administration where anything is seemingly possible.
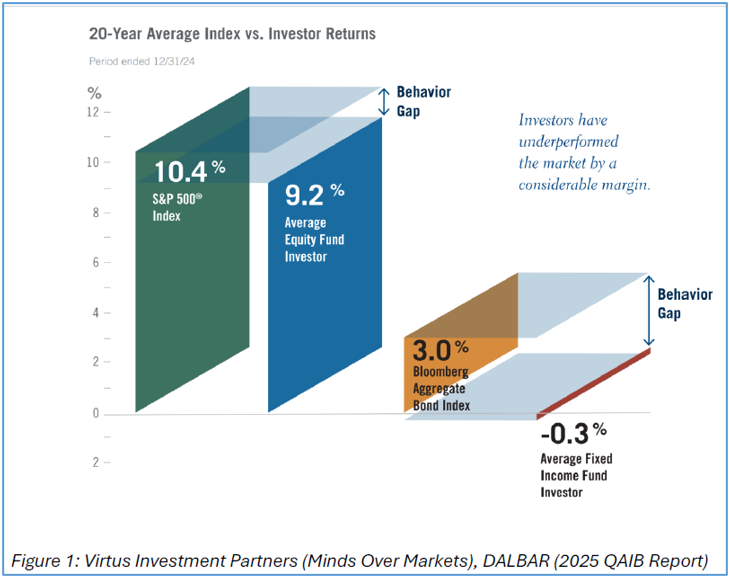
The graph below shows the outcome of a study into market returns vs investor returns where investors achieve 1.2% per year less than the market over a 20 year period due to what is characterised as the “behaviour gap” attributable to investors trying to time the market by jumping in and out based on sentiment.
If one considers the data over a longer period, this number increases to 3.6% per year in US dollar terms.
“Policy-related uncertainty in the U.S. is likely to remain elevated for some time. Rather than expending energy (and portfolio risk budget) on efforts to predict any particular outcome or to time shifts in the correlation patterns among asset classes, we believe investors should remain focused on the elements of investing that have not changed: diversification, balance, quality, flexibility, steady exposures to multiple sources of potential return, and careful risk management. Over time, the only certainty is change.”
Balancing Act: Building Resilient Portfolios in a Changing Landscape – Pimco
FORWARD OUTLOOK (OFFSHORE)
It seems as though geopolitical uncertainty is likely to persist as Trump ramps up his rhetoric around trade agreements and trade tariffs. Tariffs pose downside risk to growth (slower growth) and upside risk to inflation (higher inflation). As we saw in April, Trump’s initial approach caused too much uncertainty and threatened to negatively impact the US.
Trying to guess what or how Trump will renegotiate trade deals with the world is anyone’s best guess. And that’s exactly how Trump wants it. It’s therefore imperative that one takes a long-term view when making financial decisions. Short term fears around possible trade wars and various conflicts around the world should not lead to investors de-risking their portfolios. A more prudent strategy is to take a longer term view and to sit tight during periods of volatility and uncertainty, allowing the asset managers to manage the portfolios accordingly.
After the strong rally across global markets in the second quarter, a pullback in markets wouldn’t come as a surprise.
“We have seen a strong rally in global equities since tariff-induced volatility in early April. Stocks have consistently navigated pockets of volatility to move higher, fuelled by resilient macro data and positive news flow around trade negotiations. But, as equity markets climb back toward highs last seen in February, it leaves us asking whether valuations and sentiment have once again become too stretched.
A recession-led drawdown appears more remote to us than it did last month, but equity markets are likely to become choppier in the near term. As a result, we retain our neutral positioning in equities”
Resilience in the face of uncertainty – Franklin Templeton.
Disclaimer: The value of investments can go down as well as up. Investors may not get back the value of their original investment. Past performance cannot be relied on as a guide to the future. Changes in exchange rates may have an adverse effect on the value, price or income of foreign currency denominated securities. Investments and other services available through Asset Protection International may not be suitable for all investors. Asset Protection International does not make any warranty, expressed or implied, about the accuracy, completeness, or usefulness of any information disclosed herein. Any reliance upon any information in this document is at your sole risk. Asset Protection International and its financial advisers will not be liable to anyone for any direct, indirect, special, or other consequential damages for any use of information obtained in this document