2023 FOURTH QUARTER COMMENTARY
LOCAL MARKETS IN A NUTSHELL
The South African stock market fell -3.48% over the third quarter of 2023. Industrials being the hardest hit, down -4.9% over the quarter.
Chart: Performance of the FTSE/JSE All Share Index over the past ten years (2013/10/01 – 2023/09/30)

Source: Trading economics
The local market was off to a great start in 2023, which became muted into the second quarter and finally, turned negative in the third quarter. Global factors caused sentiment to turn negative in the third quarter which caused the local market to come under pressure.
Over the quarter, a topical issue that has been raised is in relation to South Africa’s fiscal (government revenue), economic and social deterioration. The chickens are coming home to roost as South Africa is beginning to rapidly deteriorate. Drastic change is desperately required, but it’s very unlikely that any change will be implemented in time to stop the current trajectory. This has had a negative impact on the South African bond market.
The rand continued to exhibit volatility over the quarter, reflecting the negative sentiment surrounding South African centric risk factors, as well as global risk factors. The rand initially strengthen against the US dollar by around 6% after which it weakened back to levels seen at the beginning of the quarter.

Source: Profile Data 30/09/2023
* Annualised Performance
Cry, the Beloved Country
In the API third quarter summary for 2020, we highlighted the concerns regarding the future of South Africa, in an article titled “South Africa’s default trajectory is that of a failed economic state!” We made the comment that “the government’s actions over the next 6 – 18 months could determine the economic future of the local economy in the following 10 -15 years.”
Since the article was published, some three years ago, South Africa is no better off. In fact, we have continued to rapidly deteriorate, and according to most commenters the outlook is for continued general deterioration.
The chart below shows the South African Government’s expenditure and revenue as a percentage of GDP. Since the Global Financial Crisis of 2008/09, South Africa’s expenditure has far exceeded its revenue.
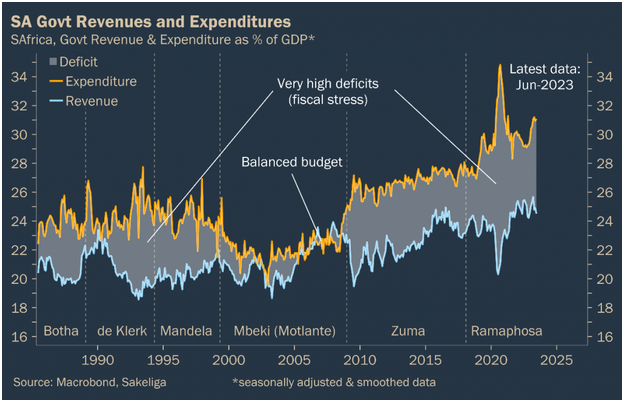
How was this possible? South Africa has had to consistently borrow money to fund its growing annual deficit. Since the 2008/2009 crisis, South Africa’s ratio of debt to GDP (GDP being a measure of productivity), has more than doubled.
From 1995 to 2008, South Africa’s annual GDP was around 3.6%. From 2010 to 2022 our GDP fell to around 1.3% per annum, as shown in the chart below. For 2023 South Africa’s annual GDP is expected to be around 1%.

In a recent economic outlook report, released by Price Waterhouse Coopers (South Africa’s largest accounting firm), Real GDP growth is expected to continue to be lacklustre at around 1.2% per annum from 2024 -2030. This is according to their baseline scenario, with their downside case being significantly worse at 0.5% per annum as shown in the chart on the left.

South Africa’s youth unemployment rate is the second worst in the world. Second only to a little-known country on the horn of Africa, Djibouti. As the chart on the right shows, be it the upside, baseline or downside scenario, youth unemployment in South Africa is expected to rise, through to 2030.
The chart below shows National Treasury’s debt to GDP expectation over the next several years. Coronation have compared this to their forecast over the same period. The bottom line is that our debt to GDP is forecast to meaningfully deteriorate over the coming years. A view shared by numerous economists and asset managers.
This view is in stark contrast to the expectations which were set by National Treasury in the 2023/24 budget, which predicted our debt levels stabilising over the next several years.
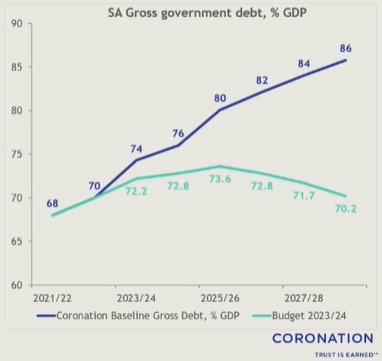
South Africa currently pays around 20% of our annual revenue to debt servicing costs. In the budget speech, National Treasury projected that debt-service costs will peak as a proportion of revenue in 2025/26 – at around 25%. In other words, a quarter of our country’s annual income is expected to go towards paying the interest on our debt in the 2025/26 financial year. Treasury’s projection of 25% is also expected to be understated.
It’s important to keep in mind that the evidence that we have shown, expresses a long-term outlook for the country, and not a rapid collapse as some may fear.
One should expect difficult times over the coming years as opposed to the much yearned for “turn around” scenario.
It is important to remember that the local economy is not the local stock market. As we continue to move forward, investment managers will continue to keep a close eye on the many issues facing our economy and position investments for the best risk adjusted return. This may take the form of an increased allocation to offshore assets.
OUTLOOK (LOCAL)
The outlook for the local market remains positive. However, given the rapid deterioration in the country, we are reminded of a comment that was made by Allan Gray’s Chief Investment Officer, Duncan Artis back in 2020.
“Over the longer term you can’t have successful companies in a country that fails. The cost of our 10-year government debt is higher than our economy is growing. Just do the maths; it can’t carry on like that. Unless we make some brave economic decisions, it won’t be long. We’re running out of time.”
Duncan Artus, Allan Gray CIO
The mid term budget speech, which is due to be delivered on the 1st of November, will hopefully give clarity as far as policy decisions are concerned. The finance minister has already publicly said that either we need to cut spending or we need to raise taxes such as VAT by a few percent. With an election around the corner and an already despondent voter base, the ANC is very unlikely to raise VAT.
A Chinese recovery could spark a rally in south African assets as sentiment shifts in favour of emerging markets.
Local assets, whilst generally regarded as having attractive valuations, are nevertheless likely to remain volatile over the remainder of the year. The rand is also likely to remain very volatile.
OFFSHORE MARKETS IN A NUTSHELL
Global equity markets had a shaky quarter as volatility increased in August and September. The MSCI world equity index fell -3.46% over the quarter in US dollars.
The graph below represents the World Equity Index over the last 4 years in US dollar terms.

*Performance as of 30/09/2023
The quarter was relatively uneventful. US credit rating was downgraded from the highest rating of AAA to AA+. This reflects growing concerns regarding their level of indebtedness, coupled with their growing budget deficit.
Many central banks chose not to hike interest rates over the quarter. The US central bank has suggested one more rate hike before the end of the year, with rate cuts expected to start in the second or third quarter of 2024.
Global inflation continues to fall from its highs, giving central banks a basis in which to pause from hiking rates any further. Forward leading indicators (indicators which help to forecast future economic activity) suggest that inflation will continue to wane. Albeit remaining higher than the US central bank’s target of 2%.
Economic activity in China, reported an increase in the month of September, suggesting a gradual stabilisation in the economy. The data has been well received, however, the market continues to look for further supportive data as well as actions from the government before deploying any capital into the region.
The Chinese property market continues to feel the weight of its indebtedness. According to 36ONE Asset Management, the Chinese authorities are now stuck between one of three options: stimulating domestic consumption, promoting new technologies such as electric vehicles and green energy technologies, or alternatively, increasing their global exports. The next 6 months may be very interesting from a Chinese policy perspective.
The US dollar surprised to the upside with the US dollar index gaining 4% over the quarter.
Following the cycle
We have been cautioning investors to expect heightened volatility. Over the past quarter, volatility unsurprisingly, rebounded. The consensus guidance going into 2023, was that the second half of 2023 would offer better opportunities.
Has this view changed?
The recent pull back in asset prices has indeed presented an opportunity for managers to exploit. Many managers still remain optimistic, particularly around the prospects for 2024. Their cautious overlay underscores the fact that the market may be exhibiting a bit too much optimism regarding a mild slowdown in global growth (and therefore a mild reduction in corporate profits, which fundamentally drives their share prices).
At this late stage in the economic cycle, the forward-looking indicators continue to support the previous narrative of optimism and opportunity.
The chart below shows the GMI Financial Conditions Index, in blue, with a 9-month lead. In other words, a projection or forecast of where financial conditions could be over the next 9-months. The ISM, which is an actual indicator of US economic activity, is shown by the white line.
It’s perhaps a bit complicated for a non-financially minded person to interpret, but what the chart shows is that according to the leading indicator, economic activity in the US is forecast to improve over the next 9 months.
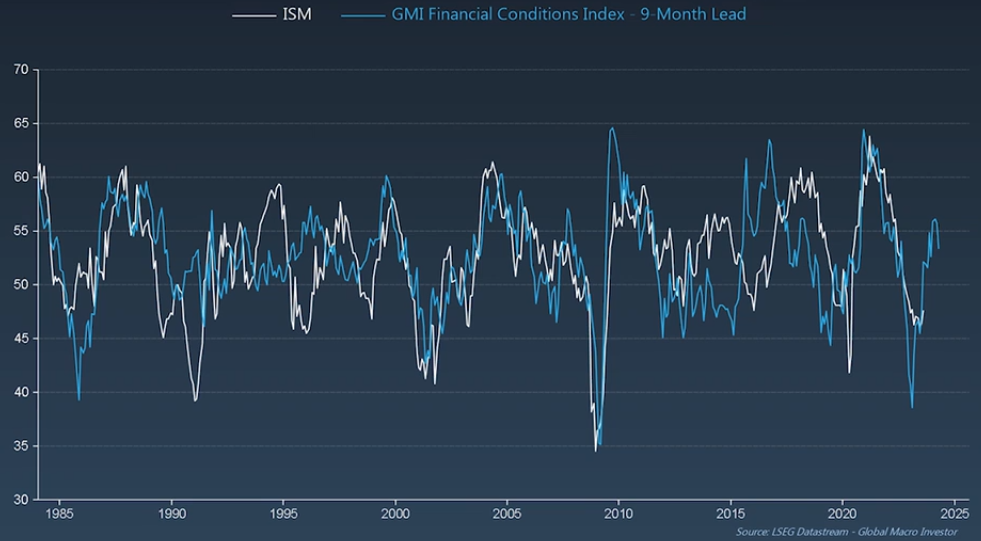
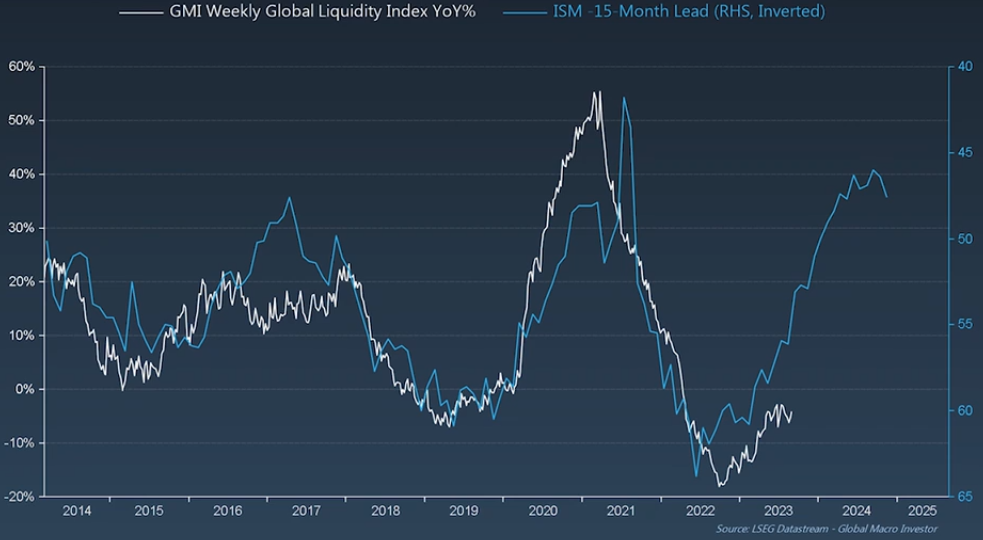
If the ISM were to improve going forward, as the chart suggests, so too would global liquidity which is illustrated in chart below.
The chart below shows that the GMI Liquidity Index tends to follow the general trend of the GMI Financial Conditions Index, this time with a 15-month lead. The chart clearly suggests that liquidity is forecast to continue to improve over the next 15 months. This is suggestive of positive sentiment for market returns over the period.
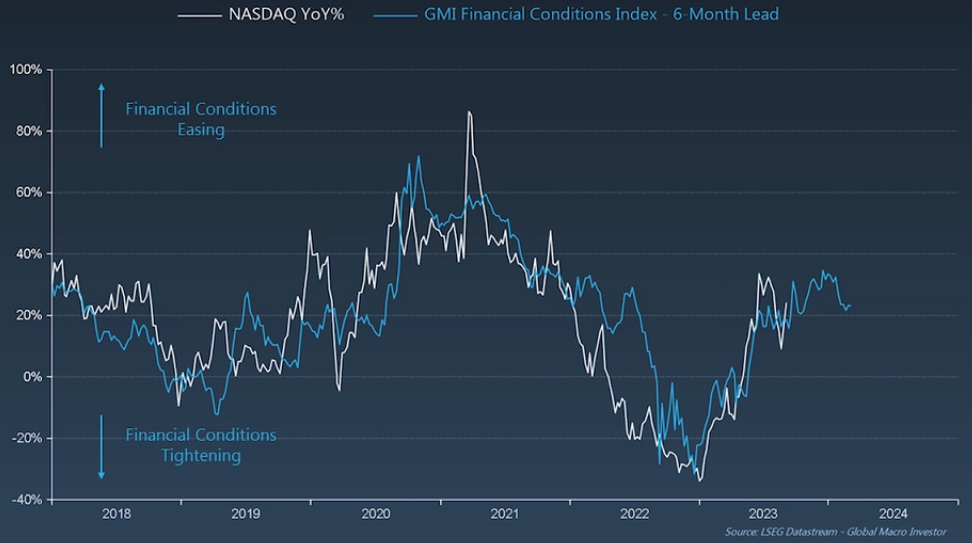
The chart below shows the GMI Financial Conditions Index, in blue, with a 6-month lead. The NASDAQ’s year on year performance has also been added to the chart, indicated by the white line. The NASDAQ is America’s largest stock market.
Simply put chart below shows, that the performance of the NASDAQ (or the S&P 500 or the “market”), tends to follow the general trend of the leading indicator.
“But what does it all mean?”
If one were to interrogate the forward-looking indicators, for the US in particular, the narrative of easing or improving financial conditions, suggests an improvement in economic activity. Along with improving financial conditions, global liquidity is also forecast to improve.
With better financial conditions, economic activity and global liquidity, markets could see an improvement in their performance going forward. This is typical of the market cycle.
Based on the forward-looking indicators, the optimistic narrative for the second half of 2023 and indeed leading into 2024, remains positive.
There are those who do not share an optimistic view. They hold a more counter cyclical view of how the future could unfold. It is important to acknowledge the different views that have emerged.
“For stocks, I think there is limited upside here. The P/E ratio on the S&P 500 has already risen by 5 points on the expectation of a soft landing. Maybe it will happen, but earnings estimates are already ambitious, and the risk is that inflation expectations are too optimistic.
My hunch is that we are in the twilight of the long-term bull market for stocks that started in 2009. If that is the case, then all we can probably hope for is a return to the old highs, or maybe slightly better. That would imply limited gains potential from here.”
Jurrien Timmer Director of Global Macro at Fidelity
It is important to note that despite what the forward-looking indicators are showing, a consensus view that remains front and centre, is that of continued volatility. In other words, the outlook going forward is positive, but we may also experience significant declines in equities along the way. This discussion is intended to share the prevailing sentiment according to leading indicators and not as evidence to use in short-term trading.
Investors need to remain committed to investing over their chosen time frame which is typically long-term and not the next 3 – 6 months.
FORWARD OUTLOOK (OFFSHORE)
The outlook remains unchanged.
For investors who hold multi-asset funds such as global balanced funds, the opportunity set in select global bonds appears very attractive. This could help complement pleasing equity returns over the coming years. Global bond yields are at multi decade highs, leading to higher conviction in this asset class, for select managers.
Geopolitical risk remains elevated. Tensions between the east and west could be a source of volatility over the remainder of the year. The opportunity set for active managers to exploit, continues to grow.
The much-anticipated recovery in China continues to elude the market, however, the longer that one waits for government stimulus, the closer we get to a policy shift, which the market hopes to spark a sustained economic recovery. China is said to be moving to an early recovery cycle, which could lead to a positive shift in sentiment towards emerging market returns.
We would expect market volatility to continue, particularly whilst the US labour market remains fairly robust, contributing to sticky inflation.
The US central bank has suggested that it may pursue one more interest rate hikes before it has reached its peak. As economic data continues to come out, this guidance may change, and markets may react favourably or unfavourably depending on the data. Regardless, the outlook over the medium term remains positive and therefore short-term views could lead to poor investment decisions.
Disclaimer: The value of investments can go down as well as up. Investors may not get back the value of their original investment. Past performance cannot be relied on as a guide to the future. Changes in exchange rates may have an adverse effect on the value, price or income of foreign currency denominated securities. Investments and other services available through Asset Protection International may not be suitable for all investors. Asset Protection International does not make any warranty, expressed or implied, about the accuracy, completeness, or usefulness of any information disclosed herein. Any reliance upon any information in this document is at your sole risk. Asset Protection International and its financial advisers will not be liable to anyone for any direct, indirect, special, or other consequential damages for any use of information obtained in this document.
