2025 FOURTH QUARTER COMMENTARY
LOCAL MARKETS IN A NUTSHELL
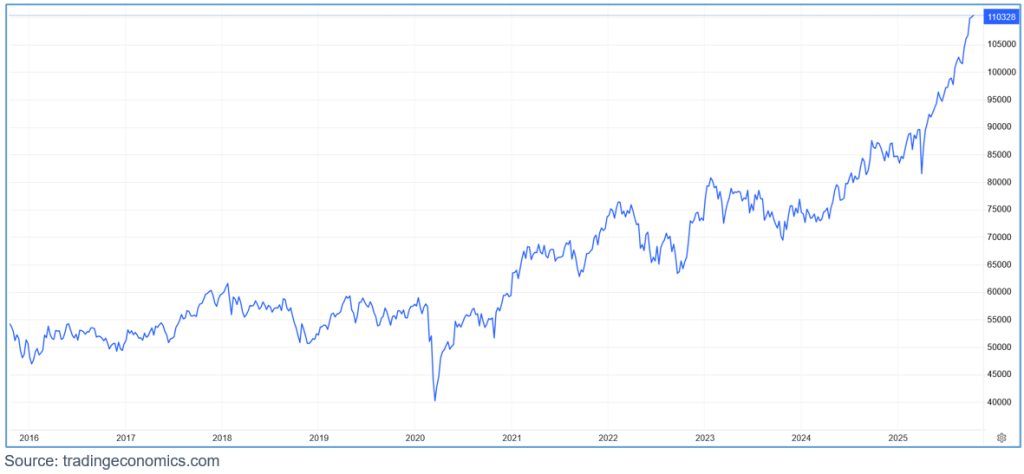
Over the quarter the FTSE/JSE All Share Index gained 12.9%, largely powered by an extraordinary 50.8% return in the resource sector, while Industrials rose just 3.7% and Financials were nearly flat at 0.3%.
South African bonds returned 6.9% for the quarter. Once again outperforming its global counterparts (Bloomberg Global Aggregate Bond Index) which was negative in rand terms.
Chart: Performance of the FTSE/JSE All Share Index over the past ten years (2015/010/01 – 2025/09/30)
In terms of economic data, Q2 GDP grew by 0.8% quarter-on-quarter, beating expectations of 0.5% and marking the strongest quarterly expansion in two years. The growth rate remains lacklustre despite beating expectations.
Politically and socially, it was a relatively subdued quarter for South Africa. Trade negotiations with the US continue.
The South African Reserve Bank has lowered its inflation target to 3% whilst voting to keep interest rate cuts on hold for now despite the expectation that inflation will rebound higher from the current 3.5%.
“In the third quarter of 2025, the FTSE/JSE All Share Index (ALSI) delivered a strong performance, fuelled by rising global commodity prices and sector-specific gains. Gold and platinum mining stocks led the rally, with gold miners and technology giants Naspers and Prosus contributing to the index’s strong total return. In contrast, domestically focused sectors struggled; discretionary and general retailers declined, while banks and insurers posted only modest gains, reflecting persistent local economic pressures.”
M&G Asset Management
Over the quarter the rand strengthened by 2.9% against the US dollar, 4.6% versus the UK pound and 2.8% against the euro.
How Have South African Asset Performed Over The Years Relative to Global Assets?
South African Investors have long since questioned whether they should have more or less exposure to offshore investment assets given the well-known idiosyncratic risks in South Africa along with the fact that the economy has grown by less than 1% per year over the last 10 years with ballooning levels of debt.
One has to recognise that there isn’t a particularly right or wrong answer.
The performance of South African assets in 2025 has taken most people by surprise. Over the last 1, 3 and 5 year period, the local stock market has outperformed the global stock market (including the famed S&P 500 US index) in rand terms, and by quite a reasonable margin at that. This contrasts to the previous 5 year period where local growth assets typically underperformed cash in the bank. It was one of South Africa’s worst periods of returns in multiple decades.
In our 2019 Third Quarter Commentary, our message to investors was as follows:
quantitative model which Allan Gray utilise suggests that the JSE All Share Index’s average annualised return over the next 4 years, should be in line with inflation + 5%. The last time their quantitative model suggested such value in the local market was 2009 at the height of the Global Financial Crisis. The period of low returns in the local market since 2015 has led the way for attractive valuations which are expected to lead to great returns going forward.
There is a consensus amongst managers such as Allan Gray, Coronation, Prudential, PSG, Foord and Investec that there are undervalued (cheap) companies in the local market which they are buying. Some of these companies derive the majority of their earnings from around the world and therefore they are not fully dependant on the South African economy. There is also a consensus amongst managers that the returns over the next 5 years will be better than what we have experienced during their period of “purgatory”.
Looking back over the last 5 years, we have certainly seen South African assets delivering very strong returns.
The table below shows the per annum returns of the 3 largest balanced funds in South Africa, each with a track record of over 25 years, as well as the average local balanced fund. The returns are also broken up into consecutive 5 year periods.
We can see that with the exception of 2015 – 2020, local balanced funds have delivered great double-digit returns on an after-fee basis.
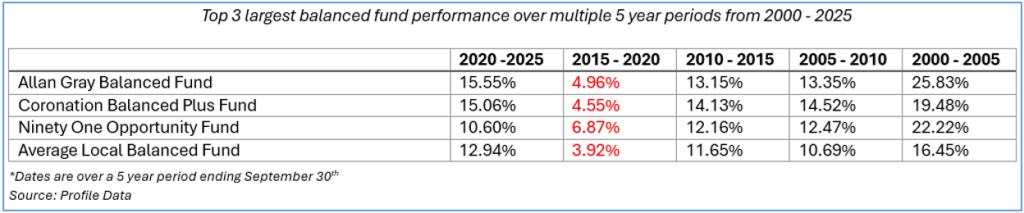
The return over the last 5 years was desperately needed to make up for the very poor returns over the previous 5 year period.
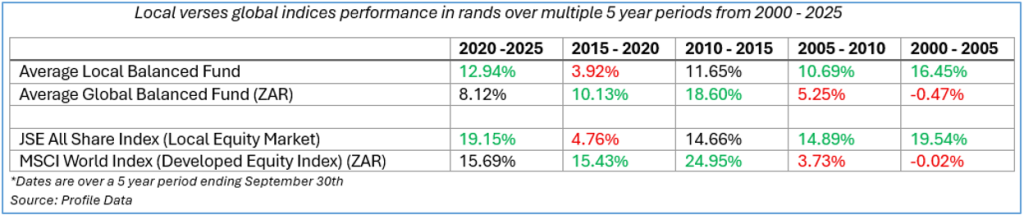
The table below compares the rand returns of the average local balanced fund against the average global balanced fund. The local market is also compared to the global stock market. We can see periods in which local outperformed global and vice versa.
The chart below shows Coronation’s expected compound annual return for the various asset classes at an index level which they hope to outperform through active management – something that they have achieved over long periods of time.
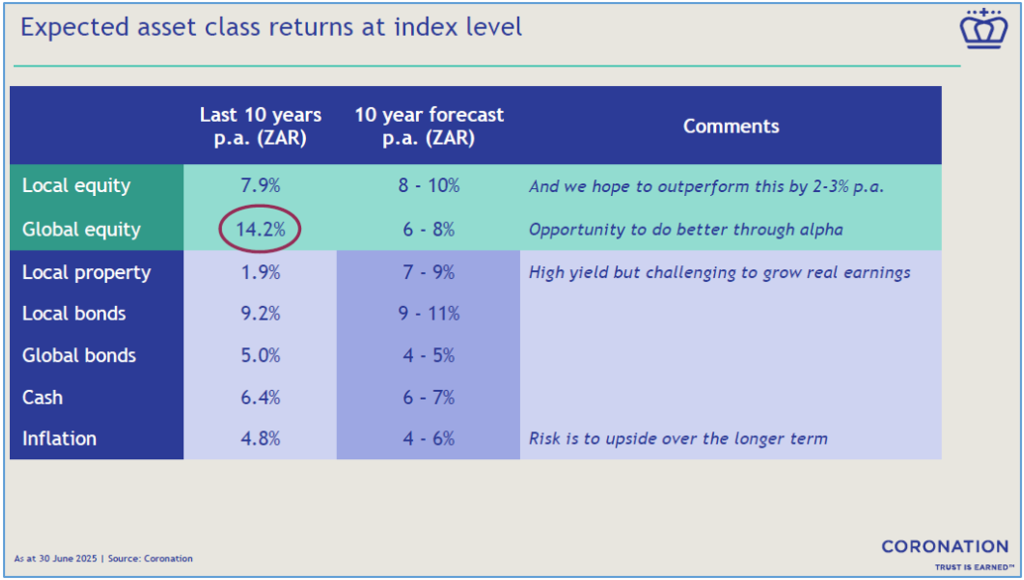
Naturally, investors are asking where to from here? To which we don’t have the answer. Will local continue to outperform global?
What we draw comfort from is the fact that asset managers are optimistic about the potential for growth over the next 5 – 10 years, be it from local or global assets.
As a “houseview”, we advocate structuring portfolios around flexible investment mandates where possible so that the asset managers can choose where to invest capital – local or offshore, for the best return at the lowest risk which can be a very dynamic process.
OUTLOOK (LOCAL)
The outlook remains unchanged. Uncertainty remains with risk to the upside in both the local and global landscape. Investment managers are nevertheless optimistic about select opportunities.
With global liquidity increasing and financial conditions easing, South African asset prices have the potential to deliver attractive risk adjusted returns despite structural and economic concerns.
On a year-to-date basis, despite the local market’s stellar return, most of the performance has been driven by a small number of resource and China-related companies, with value yet to be unlocked by most of the remaining listed companies.
OFFSHORE MARKETS IN A NUTSHELL
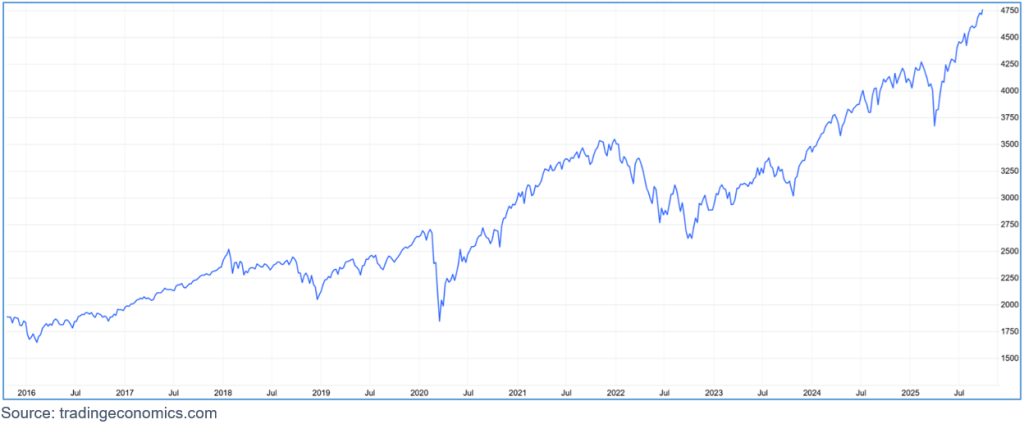
Global equity markets continued to deliver strong returns over the quarter. The MSCI world equity index gained 7.3% in US dollars. The broad US market rallied 8% over the quarter. Emerging markets were up 10.6% led by China with a staggering 20.7% return for the quarter. The UK stock market also experienced a meaningful recovery of 5.8% in dollar terms.
The graph below represents the global equity index over the last 10 years in US dollar terms.
For the most part the very successful quarter was quiet from a geopolitical standpoint.
In September the US central bank continued lowering interest rates signalling a continued easing of financial conditions which is typically good for growth assets such as equities. Equity markets continue to be fuelled by the expectation of higher growth rates driven by the artificial intelligence boom, where market leaders continue to invest significant amounts of capital to accelerate development of this technology.
Over the quarter a weaker USD helped to propel emerging markets, whilst precious metals such as gold and silver delivered 16.8% and 30.1% respectively in USD terms.
The impact of U.S. tariffs has been less severe than many pundits had forecast, inflation appears to be in check in most jurisdictions. Market participants remain concerned about the health of government balance sheets given record debt levels and the with the dominance of the U.S. dollar increasingly coming into question in a multipolar world.
The average global balanced fund is up over 15% in 2025 to the end of September.
Why You Shouldn’t Worry Too Much About The USD In Relation To Your Investments
From time to time, the media accentuates concerns around a declining US dollar amid “shifting global dynamics”. Over recent years the mounting levels of debt in the US as well as the threat of an alternative to the USD such as a potential BRICS currency, have added fuel to the fire.
Is there validity to potential concerns around the USD? Is a BRICS currency inevitable? Where does Central Bank Digital Currencies fit in?
So called experts have been debating these points for many years, postulating rather convincing arguments on all sides. It’s no wonder that some investors find the topic concerning.
From an investment perspective, we would suggest the following points:
- A structural shift away from the USD wouldn’t happen overnight. It would likely be a gradual process.
- Currencies such as the USD, GBP, EUR, JPY (Japanese yen) and the HKD (Hong Kong dollar) are cyclical in nature. In other words, they will go through periods of strength and weakness which doesn’t mean that they are fundamentally flawed as a means of exchange.
- One needs to differentiate between holding cash in a particular currency and holding assets such as shares in multinational companies.
Most global investors are likely to see their investments reported in USD despite the fact that their investments are “global” in nature.
We have selected 3 companies that are often found in client portfolios.
Company A is a US based company that is over 130 years old. It sells its product in over 200 countries around the world. The company is headquartered and listed in the US and is seen as a proudly US company despite the fact that it’s become a multinational corporation and that it reports its financial results in USD terms.
The chart below shows company A’s sales by geography. North America which includes the US, Canada and Mexico, only constitutes around 39% of the sales. Europe, the Middle East & Africa make up around 19% of the sales and so on.
Company A
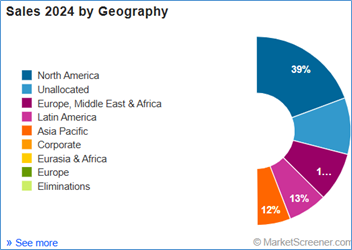
The company in question is The Coca Cola Company.
Company B was founded in a small country in Europe and is almost 160 years old. Its journey to become a global powerhouse started over 100 years ago. The company is headquartered and listed in Switzerland. The company is the largest food and beverage producer in the world and yet surveys show that most people don’t know which stock exchange it is listed on. The multinational corporation reports its financials in Swiss Franc.
As per the chart below, from a sales perspective, the company is very well diversified throughout the various geographies.
Company B
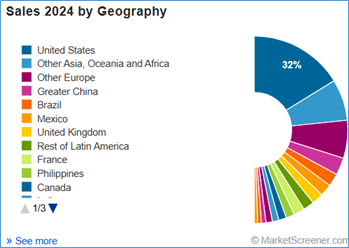
Company B is none other than Nestle.
Lastly, company C was founded in the late 1980s and is considered to be of strategic global importance. Its products are prevalent in high spec technology devices which include Tesla motor vehicles, F-35 fighter jets, medical devices such as hearing aids as well as satellites, radar technologies and consumer electronics.
Company C grew from a small microchip manufacturer on an Island in the South China Seas. Producing 80% – 90% of the microchips on the island.
The company is headquartered and listed in Taiwan as well as duel listed in the US.
As depicted in the chart below, the majority of the sales takes place within North America. Ironically, many of the components manufactured by the company are used in products which are mostly sold outside the US.
Company C
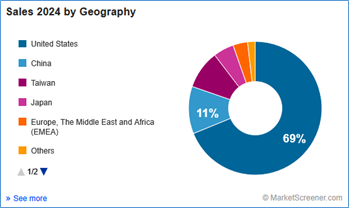
Company C is Taiwan Semiconductor Manufacturing Company (TSMC).
The message to investors is that despite the currency in which one’s investment is held, it is fairly typical to see that multinational companies have a diverse set of geographical sales which in turn is multi-currency denominated. Coke is typically purchased in local currencies.
Some asset managers utilise strategies to protect on a currency basis, whist others rather emphasise the fact that they are invested in global businesses regardless of which currency they report their earnings in.
Headlines such as “Mounting Pressure on the Dollar: Is the USD Losing Its Edge?” shouldn’t concern investors who are invested in diversified global portfolios.
FORWARD OUTLOOK (OFFSHORE)
The narrative of an easing in financial conditions and an increase in liquidity (two somewhat complex financial concepts) continues to gain momentum. In short, these are positive factors as it relates to returns in growth assets such as equities.
Valuations are high in the US, certainly relative to its own history, as well as relative to the rest of the world. But for the time being, companies are continuing to grow their earnings faster than most consensus estimates.
“Capital markets continue to climb a wall of worry, as evidenced by the rally in both equities and traditional “store of value” assets. Market commentators increasingly highlight high valuations as a risk, fuelled by extensive capital expenditures of market leaders seeking to exploit opportunities in artificial intelligence.
While we acknowledge the risks, it is worth highlighting the following: First, CEOs continue to remind us that they are “capacity constrained” as demand continues to outstrip supply. Second, reported revenue growth rates have accelerated for most of the key beneficiaries of AI. And finally, while international valuations are higher than historic levels for the market as a whole, we continue to see attractive valuations for those companies we are most bullish about.”
Peregrine Asset Management
During such euphoric periods, it’s prudent to remain committed to one’s financial plan and to expect bouts of volatility or fluctuations in the value of the investments.
Disclaimer: The value of investments can go down as well as up. Investors may not get back the value of their original investment. Past performance cannot be relied on as a guide to the future. Changes in exchange rates may have an adverse effect on the value, price or income of foreign currency denominated securities. Investments and other services available through Asset Protection International may not be suitable for all investors. Asset Protection International does not make any warranty, expressed or implied, about the accuracy, completeness, or usefulness of any information disclosed herein. Any reliance upon any information in this document is at your sole risk. Asset Protection International and its financial advisers will not be liable to anyone for any direct, indirect, special, or other consequential damages for any use of information obtained in this document.