
2026 THIRD QUARTER COMMENTARY
LOCAL MARKETS IN A NUTSHELL
Over the quarter the FTSE/JSE All Share Total Return Index fell -4.5%. Resources were hit hard, down -19.8% whilst financials were up 6.1% with Industrials up 3.4%. South African Mid and Small Cap stocks (a proxy for South African-centric stocks) were down 2.3% for the quarter.
South African bonds were up 6.4% for the quarter.
Chart: Performance of the FTSE/JSE All Share Index over the past ten years.
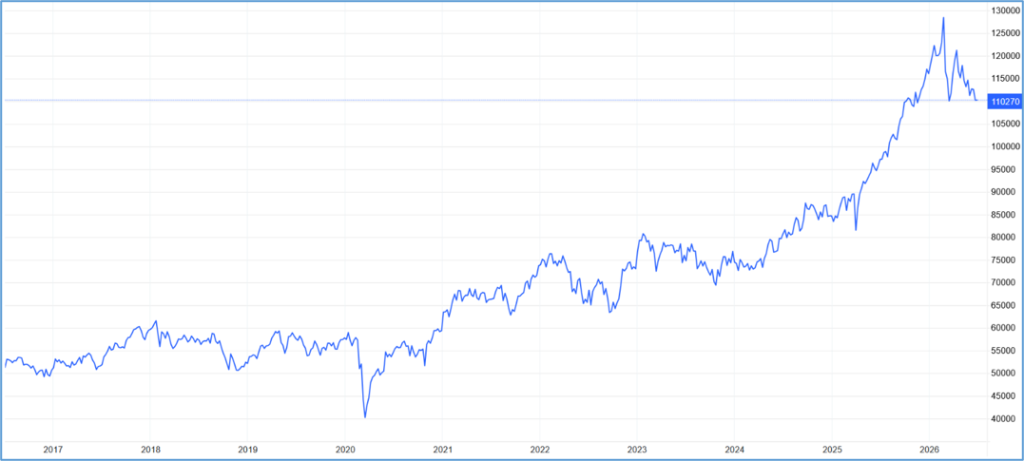
Source: tradingeconomics.com
The South African consumer continued to feel the pressure of higher living costs as a result of the increase in the fuel price and the knock-on effects to other sectors of the economy. The economy grew 0.5% in the first quarter which was largely in line with expectations. Growth expectations for the second quarter of 2026 was reduced given the level of uncertainty.
Between March 2025 and March 2026 South Africa lost 121,000 jobs with 80,000 jobs lost in the first quarter.
“In the second quarter, we saw a significant spike in the cost of living, and the SARB increased rates by a quarter of a percentage point. We expect consumers to remain under pressure for the rest of this year.”
Dr Elna Moolman, Standard Bank Group Head of South Africa Macroeconomic Research
The petrol price is expected to fall by around R2 per litre in July with diesel decreasing by R3.14 – R3.59 per litre. This should help soften some of the pressure on consumers.
As a consumption-led economy (as opposed to a service or production led economy), we are heavily reliant on the consumer.
The various numbers released thus far show little economic progress for the average South African over the last year. The tension has once again led to bouts of xenophobia across the country culminating in the March and March protest around the country.
In June, cabinet approved the Revised Industrial Development Strategy (IDS) for implementation to facilitate employment opportunities through various projects and programmes. Independent analysts have largely confirmed the doubts around the IDS. In short, there are fundamental issues such as how it will be funded, a lack of adequate measures of accountability and vagueness around implementation.
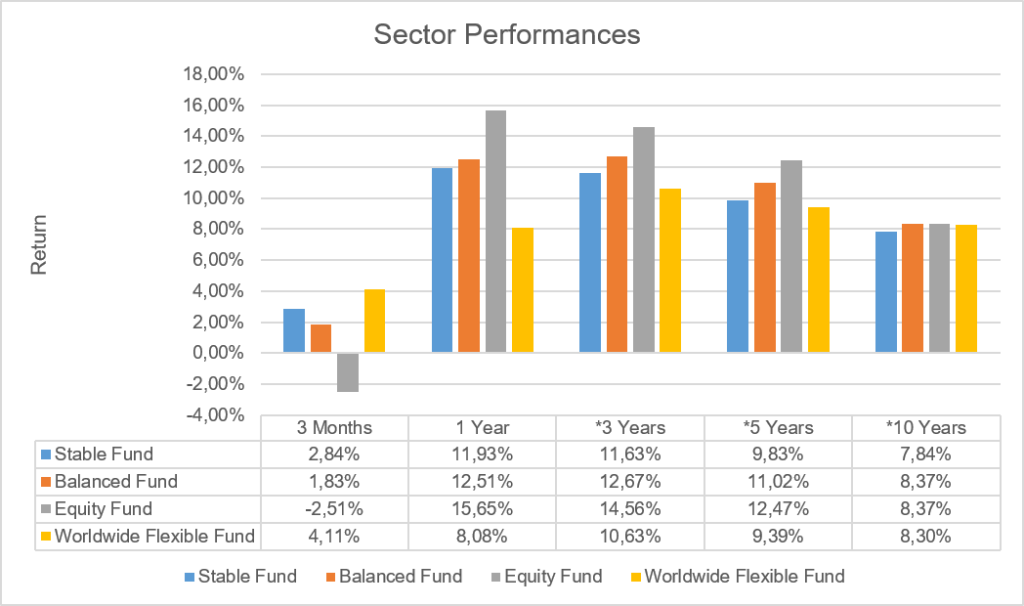
Source: Profile Data 30/06/2026
* Annualised Performance
South Africa Faces a Complex Second Half Amid Inflation, Politics and Global Risks
The second quarter has been a relatively frustrating period for South African consumers and investors. Last quarter we wrote about the fact that despite having made real progress in just less than 2 years, South Africa needs to do more to ensure that the worst is behind us.
The conflict between Iran and the US came as a reminder that South Africa is subject to exogenous risk factors which are beyond its control.
As a result of the closure in the Strait of Hormuz, the local outlook has become uncertain. A stark contrast from where we were a few months ago. A higher oil price has raised inflation expectations, lowered economic growth prospects, whist business confidence and consumer confidence have both deteriorated. These macro-economic factors remain an area of concern.
It’s expected that interest rates will continue to increase by the end of the year. The degree to which they will increase is subject to what plays out in the inflation numbers. With a supply shock such as the Iranian conflict, despite the fact that the oil price has fallen back to pre-conflict levels of around $71/barrel, there is a lag effect to this feeding through to the South African consumer. In other words, the price of fuel, food, goods etc. won’t immediately revert back to pre-conflict levels.
In a recent update, 36ONE Asset Management reiterated that both locally and globally, interest rates are likely to remain elevated going forward. They highlighted the upside risk to local food inflation as well as the fact that South African GDP (economic activity) remains constrained.
On a more positive note, they maintain their view that the global growth outlook remains positive. South Africa is also expected to collect more in taxes than previously forecasted which is good for the fiscus (South Africa’s financial resources).
From a stock market perspective, around 45% of the index consists of the resource sector (gold, platinum etc.) as well as Naspers/Prosus which primarily holds a Chinese tech company. The South African stock market has often been recognised as a concentrated one. However, many are sounding the alarm around the need to be very selective from here.
The political backdrop in South Africa also adds another element to the current complexity. Political and economic analyst Frans Cronje suggests that South Africa is in the process of a regime change, particularly at a municipal level, and that such a change can be messy and disruptive. We have set the expectation for quite some time, that 2026 will be subject to various challenges with geopolitical tensions running high.
We continue to emphasise the fact that the reminder of the year is likely to be very noisy. The Phala Phala impeachment process along with the municipal election in November will be part and parcel of the push for regime change in South Africa.
As a result of all the factors at play many asset managers have increased their exposure to locally listed global companies such as the beverage manufacturer Anheuser-Busch as well as Bid Corp. This highlights the activity that is taking place in portfolios in response to the complex dynamic environment. Investors can continue to expect asset managers to allocate capital for the best risk adjusted return.
The Local Currency Conundrum
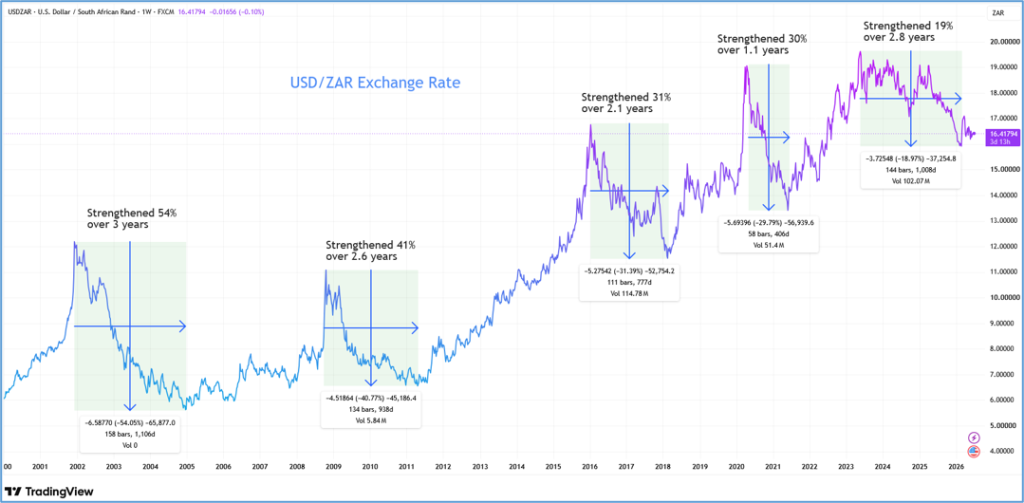
Since the rand peaked against the USD in May 2023, the currency has been a detractor for offshore investments when measured in rand terms. This includes a portion of local balanced funds which typically hold at least 30% in direct offshore exposure.
As South Africans, we often expect the local currency to weaken over time however, there are periods where the currency strengthens.
The chart below shows the USD/ZAR exchange rate since the turn of the millennium. What we can see is that the rand has undergone 5 periods of prolonged strength. If we measure the top to bottom (peak to trough) of each point, the rand has strengthened between 19% and 54%. With the exception of this current cycle, the rand has historically strengthened by 30% or more.
This has also lasted between 1.1 and 3 years. What’s unique about this cycle is the fact that the rand strength has been relatively shallow thus far. In other words, it’s only strengthened 19% from top to bottom. However, this cycle has been relatively protracted with the top to latest bottom taking 2.8 years.
An analysis of data from 2021 – 2026 (1,299 trading days) found that 67% of the USD/ZAR movement (variance) was explained by the movement in the USD Index (an index where the USD is compared to a basket of currencies such as the Euro, Japanese Yen, Pound etc). In other words, the movement in the rand has less to do with local factors and more to do with global factors. As South African’s we often assume that the rand is inherently linked to the actions and realities within the country. The reality is more nuanced than this.
The current bout of rand strength has coincided with a period where the USD index has strengthened from a top of 114 to a bottom of 96.
Where will the rand be in a year’s time?
Your guess is as good as anyone’s. What asset managers agree on is that structurally the rand weakens over time, not withstanding these bouts of strength along the way.
The table below shows the ZAR and USD return of the Satrix ZAR and USD index tracking funds which track the MSCI World Developed Market Equity Index. Despite the fact that the underlying index is the same, the ZAR return and USD return are vastly different over the various periods.
| Fund | 1 Year Return | *3 Year Return | *5 Year Return |
| Satrix MSCI World Index Fund (ZAR) | 13.94% | 13.53% | 15.32% |
| Satrix World Equity Tracker Fund (USD) | 26.99% | 21.40% | 11.65% |
*Returns are annualised
Source: May 2026 Satrix Factsheet
So, what is one to make of all this?
Ultimately, the key takeaway is that currency movements can materially distort the way investors experience offshore returns in rand terms over shorter periods. While rand strength can make offshore exposure appear less attractive, it does not change the long-term rationale for global diversification. Investors should therefore avoid making investment allocation decisions based solely on recent currency movements and instead remain focused on the underlying investment case, appropriate time horizons and the role that offshore assets play in reducing portfolio concentration risk over time.
FORWARD OUTLOOK (LOCAL)
Looking ahead, investors should expect continued uncertainty and elevated market volatility as geopolitical risks, inflation pressures, higher interest rates and South Africa’s political transition remain key drivers of sentiment. While global growth remains supportive and South Africa’s fiscal outlook has improved modestly, local economic activity is likely to stay constrained. In this environment, portfolio selectivity, diversification and exposure to quality companies with resilient earnings will remain important as asset managers seek the best risk-adjusted returns.
OFFSHORE MARKETS IN A NUTSHELL
Global equity markets saw strong momentum in the second quarter. The MSCI World Equity Index rose by 13.7% in US dollars. The broad US market gained 15.2% over the quarter, led by the tech and semiconductor sectors.
Emerging markets were up 24.1% whist China was down -6.6%.
The graph below represents the global equity index over the last 10 years in US dollar terms.
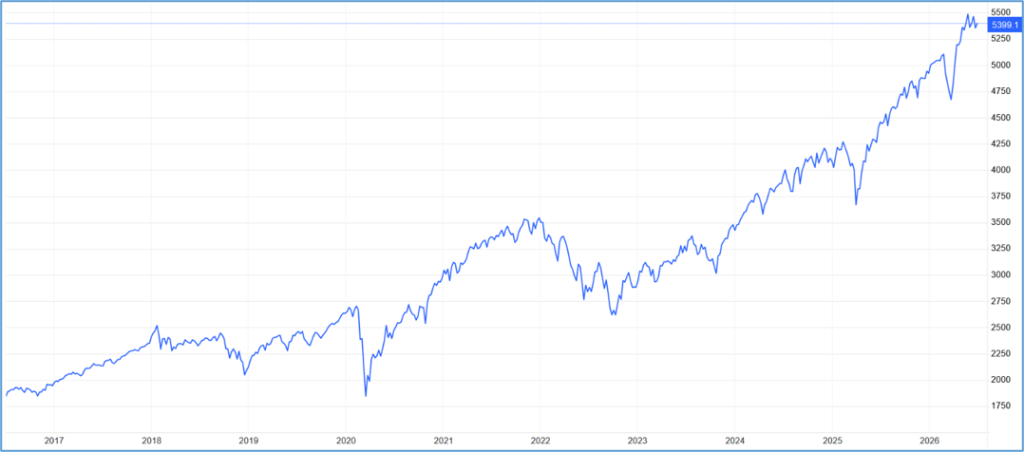
Source: tradingeconomics.com
The past quarter saw a number of significant events playing out. After 110 days of conflict between the US and Iran a memorandum of understanding was finally signed, allowing the Strat of Hormuz to reopen. The price of oil has gradually declined from its March high of $119/barrel to its current price of around $73/barrel.
With the oil shock appearing to be at its end, the world looks to a more normalised environment with cheaper energy and transport costs.
The US central bank also ushered in its new chairman Kevin Warsh, after repeated attacks by Trump on the previous chairman who was reluctant to lower interest rates. It marks a significant move towards a new era of policy making by the US central bank.
The quarter also saw the largest IPO (listing of a private company) in history. SpaceX the brainchild of Elon Musk came to market as the 5th largest company in the world. OpenAI, the creator of ChatGPT and Anthropic the creator of AI platform Claude, are also expected to list in the US before the end of the year. These IPOs are already creating interesting dynamics within the market.
Toward the end of the quarter the UK Prime Minister Kier Starmer resigned amidst mounting political pressure. The last Prime Minister to serve a full term in the UK was David Cameron. Since then, there have been 5 Prime Ministers in the last decade.
Managing the AI Risk in Portfolios
The AI trend is well established and accelerating at a rapid pace. The November 2022 launch of ChatGPT catalysed a massive boom in the generative AI application layer. In 2023 Claude become the biggest competitor to ChatGPT with Google Gemini also securing its place in the top 3.
The AI boom has resulted in a handful of tech companies leading much of the market’s performance for the last several years. Many of these companies being related to AI infrastructure (micro chips) and AI processing which enables these AI platforms the compute in which to operate.
The amount of money that is being spent on AI development is unprecedented. It has been compared to an arms race not only between companies but also against countries where potentially, the winner takes all.
To put it into perspective, the chart below shows the total estimated AI spend in 2026 against the inflation adjusted expenditure of various notable projects. It is expected that the AI spend in 2026 will be 4.3x bigger than the total lifetime cost of both construction and operation of the Internation Space Station or over 21x the cost of the Manhattan Project.
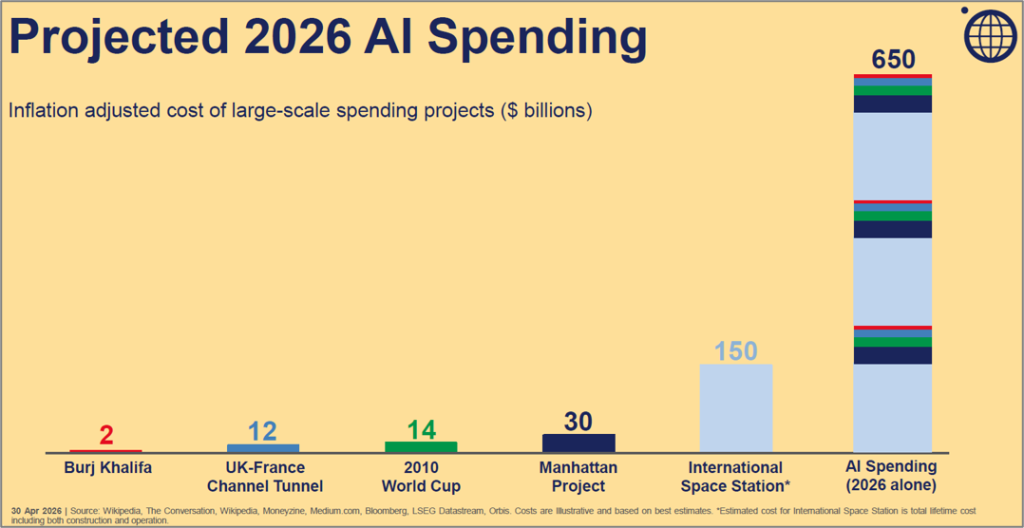
As we move from AI development to scaled AI adoption, coupled with other technologies such as robotics, the question around fundamental disruption becomes an important consideration when looking at investments and investment risk.
The chart below illustrates how Orbis categorise the top 40 companies that they hold into various “Styles” such as Defensive, Growth and Value. This is something that they have done for many years.
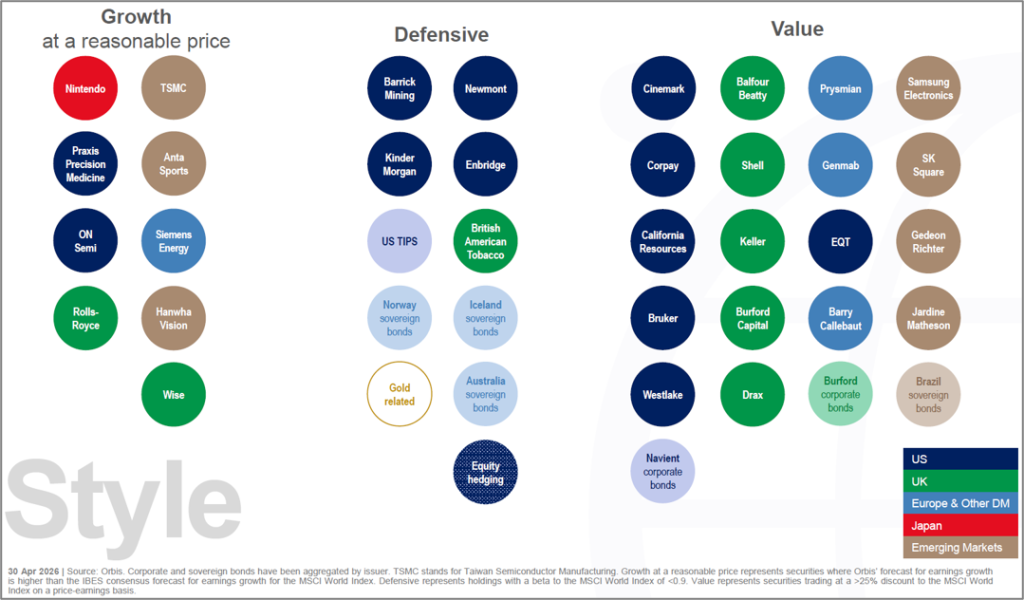
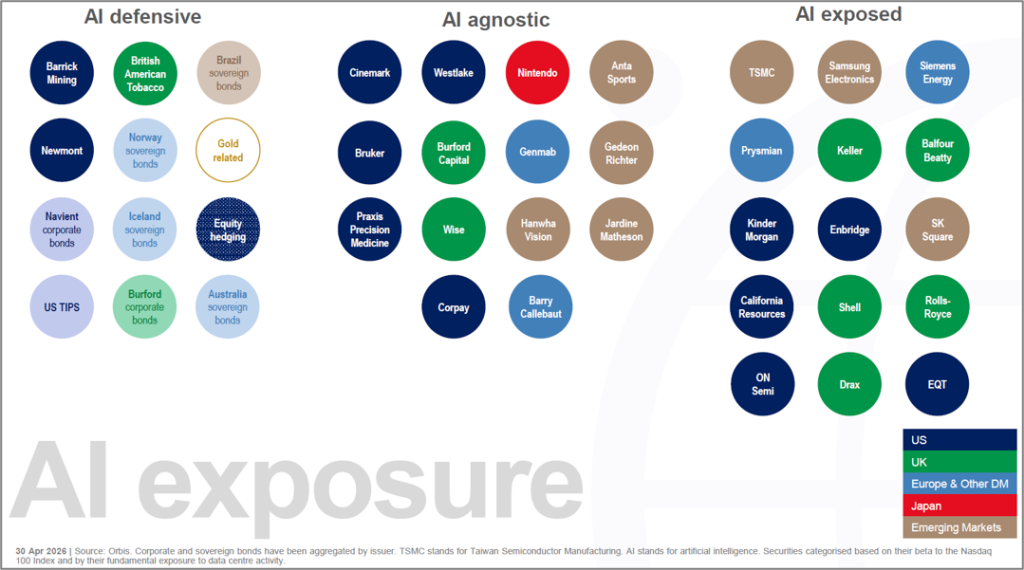
With the AI disruption boom, Orbis have also created an AI exposure overlay where they categories the various companies into high disruption (AI exposed), low disruption (AI defensive) and AI agnostic. This illustrates the emphasis around opportunities and threats to these businesses and therefore the investment thesis (the reason for investing in these businesses).
The snapshot below shows how Coronation classify the top 25 companies in the Optimum Growth Fund into Themes as well as AI Classification where they classify companies into AI winners (companies that will benefit from AI) as well as those in the AI crosshairs (companies that are at high risk of disruption).
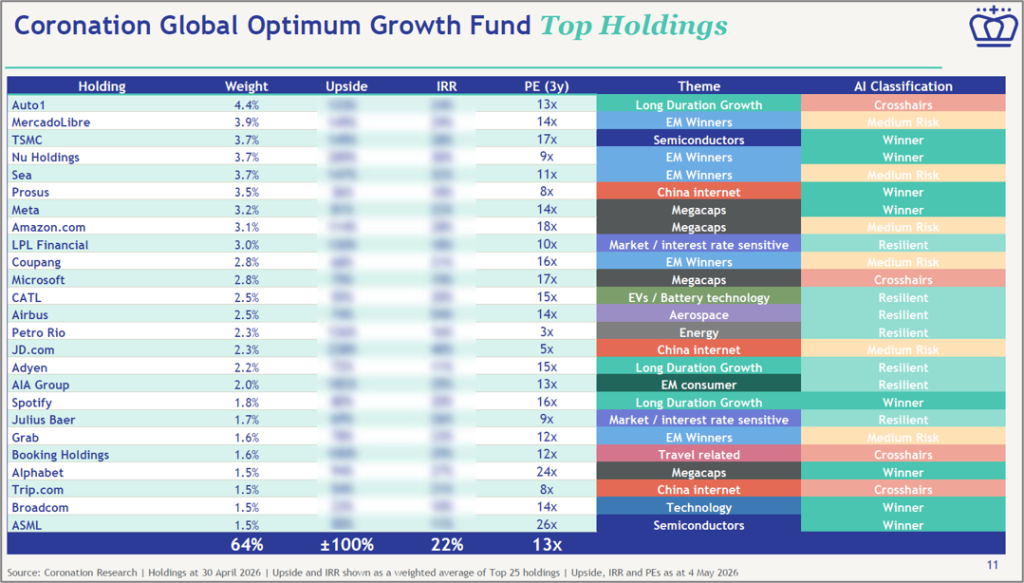
As one can see, asset managers are acutely aware of both the AI risks and opportunities.
The snapshot above shows that Coronation expect a compound annual return of 22% in USD over the next 5 years based on a 100% upside to fair value in the top 25 companies that they hold in the Optimum Growth Fund.
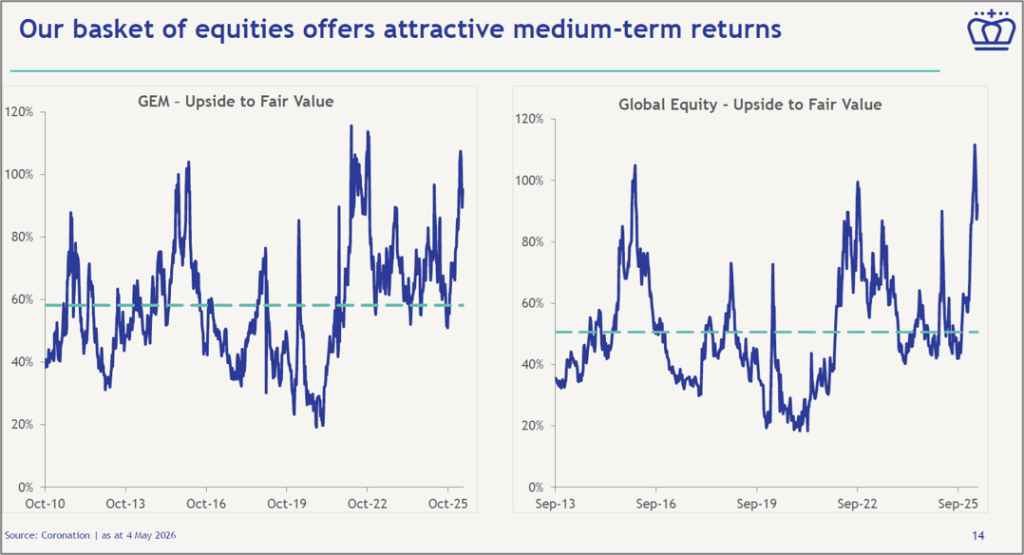
The chart below is one that we have used for many years. It shows the total upside to fair value of the companies that Coronation hold. They show the upside to fair value in their Global Emerging Market (GEM) equity holdings on the left-hand chart as well as their global companies on the right-hand chart where the upside to fair value is around 90%.
There has seldom been a point in the last 13 – 16 years where the upside has been this attractive. Particularly on the global equity side (right hand chart).
Given the attractiveness of select offshore assets, it worth reiterating that investments require an appropriate time frame for investment themes to play out.
The latest research shows that the average holding period for US stocks has fallen from 5.2 years in the 1970s to just 5.5 months.
‘It is so clear to us when we are looking at portfolios and stock movements every day that market prices are increasingly dislocated in the short term from their fundamentals
Neil Padoa, Portfolio Manager – Coronation Asset Management.
This highlights the fact that investors need to exercise patience whilst fundamental fund managers such as Allan Gray/Orbis and Coronation navigate complicated market trends such as AI.
Unfortunately, markets have become more volatile as a result of passive investment trends (index funds) and shorter holding periods, as well as geopolitical shifts.
Not only do investors need to exercise patience, but they also need to endure higher levels of volatility. Research has shown that volatility has increase sharply over the last decade compared to long term averages.
FORWARD OUTLOOK (OFFSHORE)
Macro-economic growth remains steady but below historical norms. Global GDP is expected to expand at roughly 3.0–3.3% through 2026, supported by easing financial conditions, technology investment (particularly AI), and continued adaptability in the private sector. However, this masks divergence between regions: advanced economies are growing at ~1–1.5%, while emerging markets continue to deliver >4% growth, driven by domestic demand and structural tailwinds.
Inflation is trending lower but not fully normalised with many analysts suggesting that it will remain higher for longer.
Geopolitical risks remain elevated and despite the progress that has been made to reopen the Strait of Hormuz, there is likely to be incidents between Iran and the various parties that transit the strait as well as those within the region.
Disclaimer: The value of investments can go down as well as up. Investors may not get back the value of their original investment. Past performance cannot be relied on as a guide to the future. Changes in exchange rates may have an adverse effect on the value, price or income of foreign currency denominated securities. Investments and other services available through Asset Protection International may not be suitable for all investors. Asset Protection International does not make any warranty, expressed or implied, about the accuracy, completeness, or usefulness of any information disclosed herein. Any reliance upon any information in this document is at your sole risk. Asset Protection International and its financial advisers will not be liable to anyone for any direct, indirect, special, or other consequential damages for any use of information obtained in this document.