
2026 FOURTH QUARTER COMMENTARY
LOCAL MARKETS IN A NUTSHELL
Over the quarter the FTSE/JSE All Share Total Return Index fell -0.3%. Resources were the standout sector gaining almost 14%. Financials, Industrials, South African Mid and Small Cap stocks (a proxy for South African-centric stocks) were all negative for the quarter.
South African bonds were down around -1% for the quarter.
Chart: Performance of the FTSE/JSE All Share Index over the past ten years.
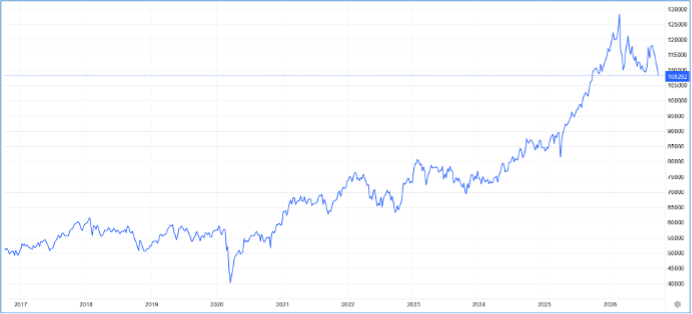
Source: tradingeconomics.com
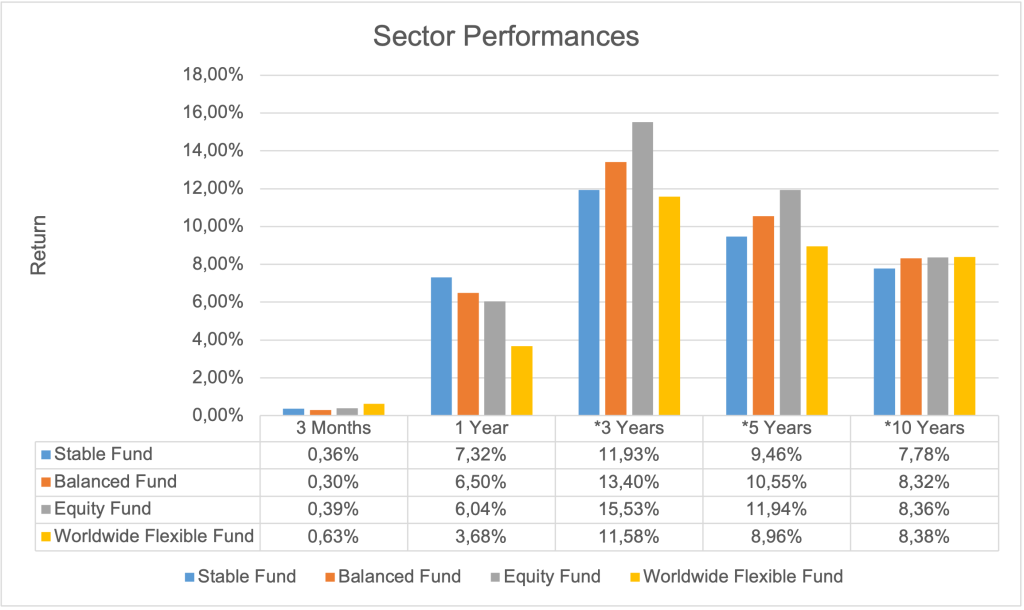
Source: Profile Data 30/09/2026
* Annualised Performance
FORWARD OUTLOOK (LOCAL)
Very little has changed in terms of the outlook from local assets – they remain attractive. Despite a potentially less favourable environment for South African assets than was expected 6 months ago, their fundamentals haven’t changed.
Political uncertainty is likely to endure as we head to municipal elections. Inflation remains an area of concern as does the possibility of further interest rate hikes. One can draw similarities to the current environment and that of 2022 where inflation reached 7.8% and interest rates spiked. Thankfully none of the asset managers feel that a repeat of 2022 is a likely scenario. The consensus is that the main driver of inflation is the oil price linked to the Iranian conflict which could come to an end at any point.
Drawing some of the basic parallels to 2022 makes the point that we are in an environment where returns can be relatively lumpy and therefore uncomfortable.
Regardless of the outcome in the municipal election, and any political posturing within the GNU, investors should view this simply as noise. Businesses will continue to operate and will adapt regardless of the outcome.
OFFSHORE MARKETS IN A NUTSHELL
The global equity market was up marginally in the third quarter. The MSCI World Equity Index gained 1.9% in US dollars. The broad US market gained 2.2% over the quarter, led by the tech and semiconductor sectors.
Emerging markets were down -0.4% whist China was up 3.3%.
The graph below represents the global equity index over the last 10 years in US dollar terms.
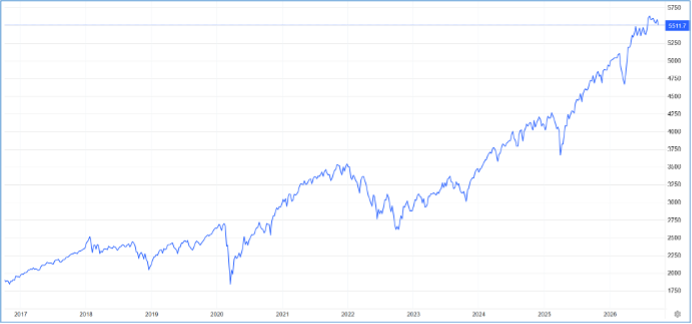
Source: tradingeconomics.com
The third quarter was marked by heightened geopolitical and macroeconomic tensions: the war in the Middle East pushed Brent crude back above USD 100 per barrel.
Despite these headwinds, the global economy proved resilient. The US remained the main engine of developed-market growth, supported by robust business investment, artificial intelligence (AI)-related capital expenditure and an improving labour market.
This resilience, combined with a buoyant earnings backdrop, helped global equities reach several record highs during the quarter.
THE NUANCED DILEMMA OF MARKETS IN 2026
2026 has been a particularly interesting year. Market concentration has been exceptionally high with A.I. related stocks driving the majority of the index return. On some measures the market concentration is as high as it was in the 2000 tech bubble whilst other suggest an even higher concentration. This is causing a large dislocation between the performance of diversified (predominantly actively managed) portfolios and typical index ETFs.
The chart below shows the extreme concentration to the AI related theme within the MSCI All Country World Index (ACWI) and the MSCI Emerging Market Index. Regardless of how one views it, if you were to hold the index, the outcome is heavily dependent on one theme, which admittedly holds a high merit in portfolios.
After all, the technology is revolutionising the world.
AI Related Exposure in the Global Equity MSCI All Country World Index (ACWI) and MSCI Emerging Market Index
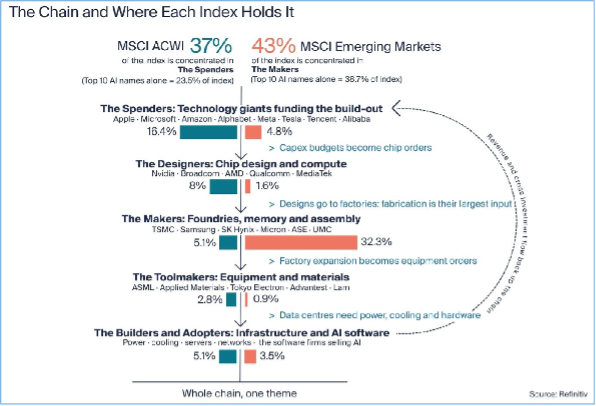
With a high market concentration, where Nvidia’s value is greater than the entire S&P 500 Energy, Materials and Utility sectors combined, the issue of whether this is a bubble has been heavily debated.
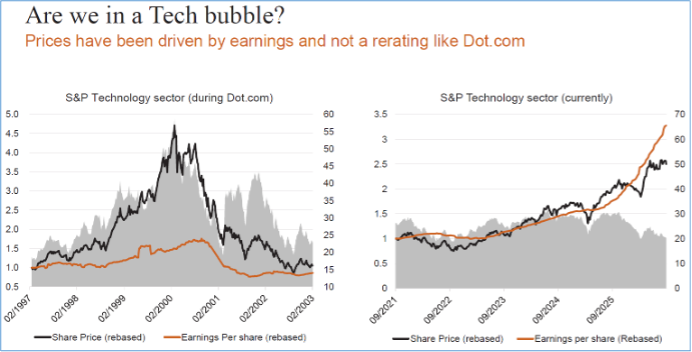
Parallels are often drawn between the technology bubble of the early 2000s and today. In the early 2000s the technology sector saw prices rise exponentially whilst their earnings failed to justify the price. When the bubble burst, all was revealed.
As per the chart below, despite the fact that the market is as concentrated as it was around the technology bubble, if not more, this time is different in that companies have meaningfully grown their earnings.
Source: Fairtree Asset Management
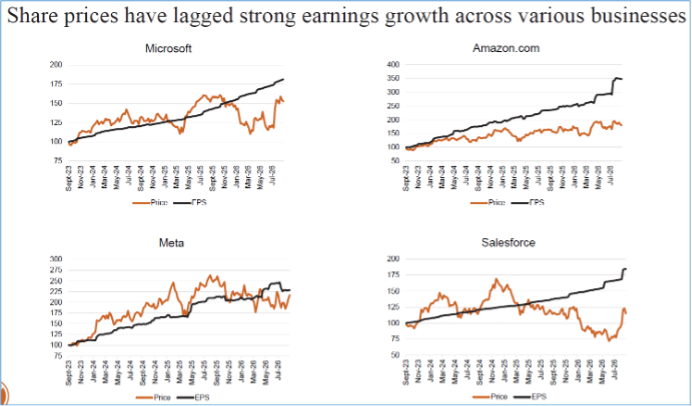
The fundamentals of a company’s value is predominantly linked to its ability to grow its earnings over time. The charts below show the share price of the various companies in orange along with their earnings per share (the black line). If one follows the rationale that over the long term, the orange line should follow the black line, one could assume that there is still value to be had in these companies.
Source: Fairtree Asset Management
With regards to the AI theme, asset managers are being very selective in what they hold.

If the equity index is growing both in price and in earnings and one assumes that this isn’t a bubble, then shouldn’t one find comfort in holing the index or an index-like concentration?
This is an extremely nuanced topic but in short, it comes back to the fact that if one is heavily exposed to one theme (A.I.) which is delivering exceptional returns well above historical averages, when earnings growth starts to abate or if supply chain issues were to arise, the share price of these companies could become very vulnerable.
The chart below shows one of the companies owned by Orbis – Anta Sports Products. It shows that Anta (the blue line) is trading at a discount to Fast Retailing (the red line) and yet Anta is growing its sales per share at a much higher rate than Fast Retailing.
Since 2020 Anta’s earnings per share has grown around 140% whilst its share price is over the same period is flat.
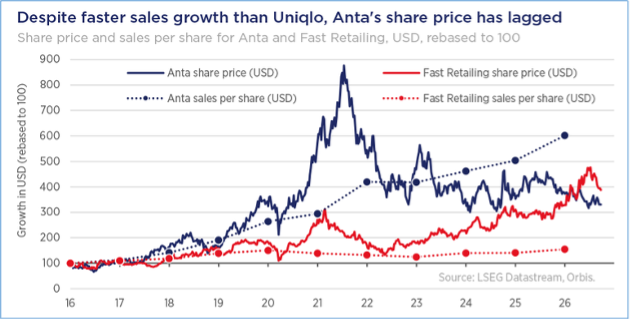
Anta Sports Products is likely to be an unknown company to most investors. Perhaps somewhat of an unrelatable company in the context of the A.I. hype. Nevertheless, active managers such as Orbis have chosen to hold the likes of Anta alongside, to a lesser degree, select A.I. companies. Once again, the idea of a diversified portfolio is unlikely to deliver such concentrated returns.
Othe overarching message is that investing based on past performance or short-term relative performance can mask a far more nuanced set of risks that typically takes time to play out.
FORWARD OUTLOOK (OFFSHORE)
The momentum in A.I. related stocks remains very strong driven by both sentiment as well as a supportive earnings backdrop. There are large parts of the market that have been viewed as A.I. losers. Businesses that are ripe for disruption. A great example of this is Booking.com. Its earnings per share is up around 55% over the 3 years whilst the share price is up around 30% on the back of A.I. disruption fears.
The disconnect between earnings and stock market performance is extremely nuanced particularly on a stock-by-stock basis. Despite the backdrop of higher inflation and potentially higher interest rates globally, the overall US economy remains resilient. Active managers are beating the drum at how positive they are. Long term return prospects as earnings is in many cases outstripping share price performance. Meanwhile many investors are expressing their disappointment at the relative returns compared to very select stock market indices.
As the A.I. theme plays out and A.I. buildout moves to A.I. application, some of the “A.I. losers” may prove to have been wrongfully sold off such as Bookings.com. Unfortunately, these themes need time to unfold which can be very frustrating for investors.
A key risk over the short term is undoubtedly the uncertainty around inflation and the knock-on effect that this could have on interest rates. This is something that asset managers are watching very closely.
Disclaimer: The value of investments can go down as well as up. Investors may not get back the value of their original investment. Past performance cannot be relied on as a guide to the future. Changes in exchange rates may have an adverse effect on the value, price or income of foreign currency denominated securities. Investments and other services available through Asset Protection International may not be suitable for all investors. Asset Protection International does not make any warranty, expressed or implied, about the accuracy, completeness, or usefulness of any information disclosed herein. Any reliance upon any information in this document is at your sole risk. Asset Protection International and its financial advisers will not be liable to anyone for any direct, indirect, special, or other consequential damages for any use of information obtained in this document.